File:AircraftCompressorDischargeTemperatureVSAltitude.jpg
From Wikimedia Commons, the free media repository

Size of this preview: 778 × 600 pixels. Other resolutions: 311 × 240 pixels | 623 × 480 pixels | 996 × 768 pixels | 1,280 × 987 pixels | 1,385 × 1,068 pixels.
Original file (1,385 × 1,068 pixels, file size: 233 KB, MIME type: image/jpeg)
 |
This graph image could be recreated using vector graphics as an SVG file. This has several advantages; see Commons:Media for cleanup for more information. If an SVG form of this image is available, please upload it and afterwards replace this template with {{vector version available|new image name}}. |

Summary[edit]
| Description |
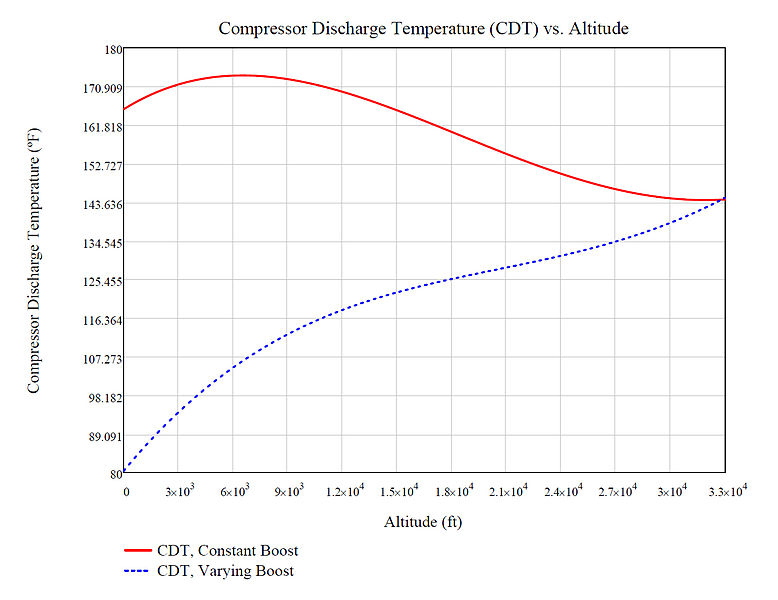
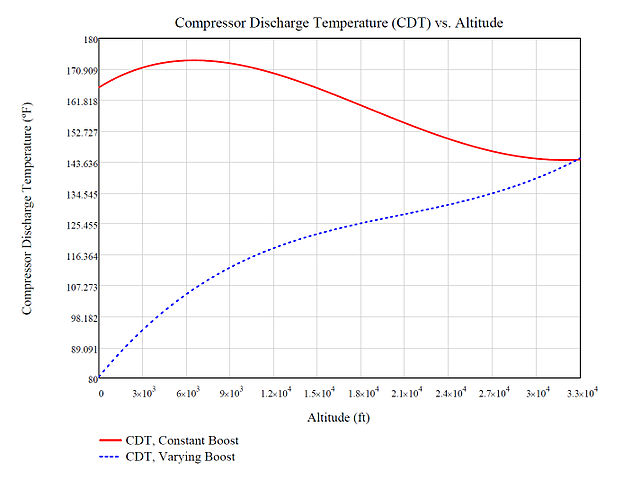
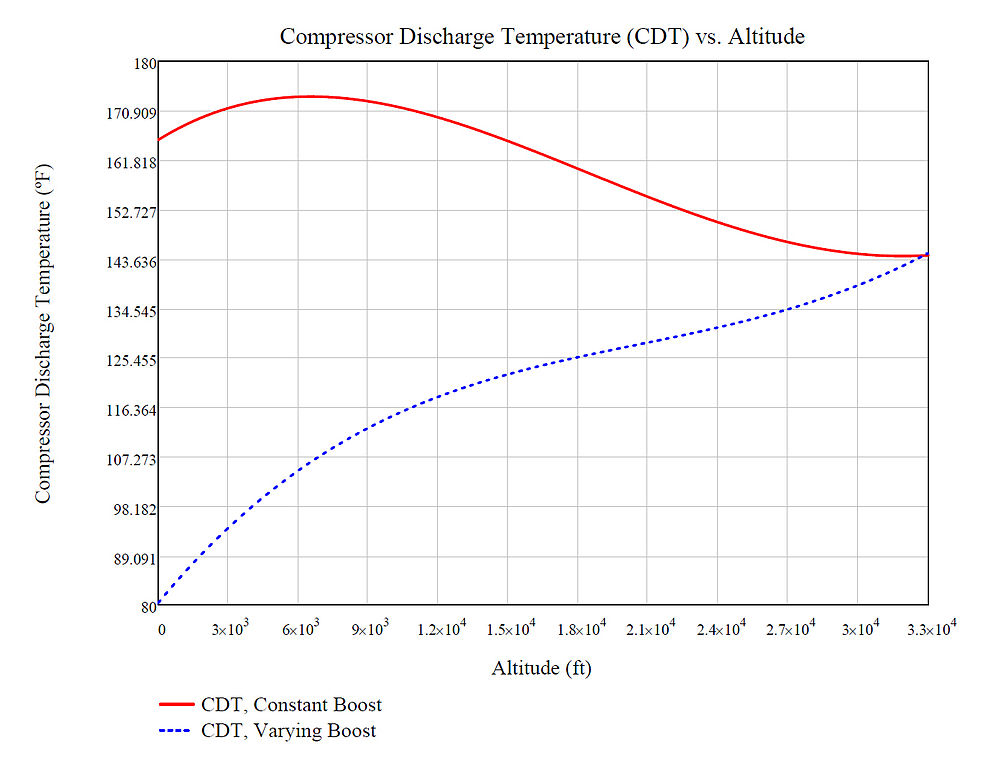
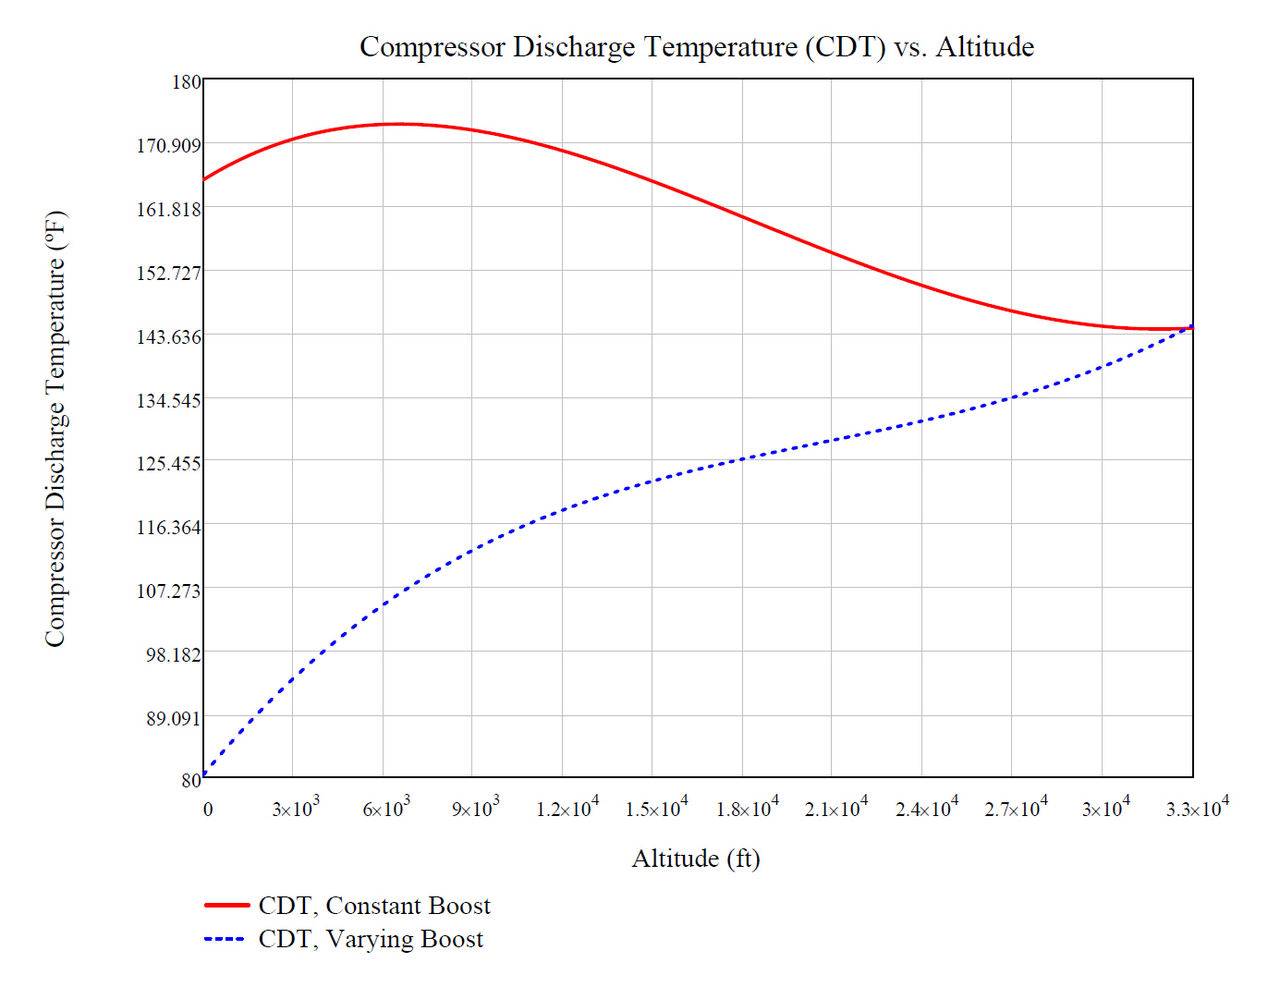
English: This graph compares the compressor discharge temperature on a supercharged aircraft engine as a function of altitude. Ambient atmospheric temperature and pressure are calculated using standard atmospheric models. The red line assumes the supercharger is putting out constant boost of 10.2 psia (0.70 bar), sufficient boost to make up for the atmospheric pressure at 10,000m (32,800ft) altitude. The blue dotted line assumes a constantly varying boost to maintain the engine's manifold pressure at 1 atm (14.696 psia). It can be seen that constantly varying the boost significantly reduces the CDT of the supercharger (although it also results in lower power output).
|
| Date | |
| Source | Own work |
| Author | OptoMechEngineer |
Licensing[edit]
|
I, the copyright holder of this work, hereby publish it under the following licenses:
You may select the license of your choice.
|

File history
Click on a date/time to view the file as it appeared at that time.
| Date/Time | Thumbnail | Dimensions | User | Comment | |
|---|---|---|---|---|---|
| current | 19:12, 3 July 2012 | | 1,385 × 1,068 (233 KB) | OptoMechEngineer (talk | contribs) | Higher resolution export of chart. |
| 18:27, 14 December 2009 | 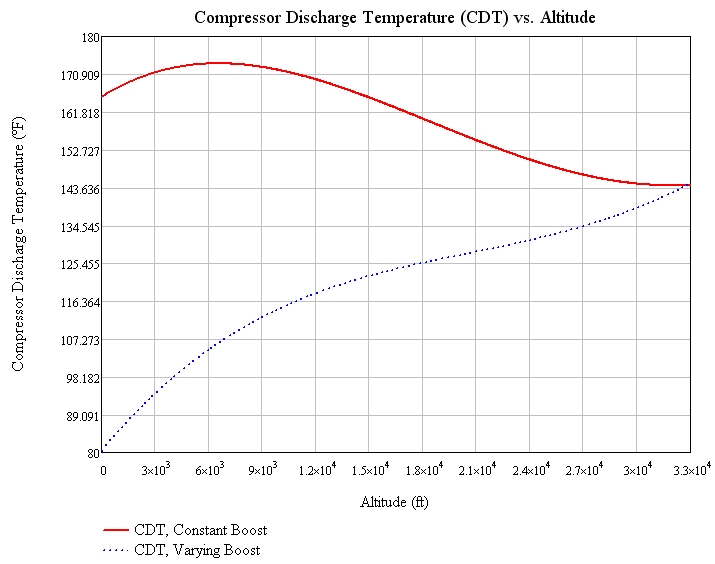 | 715 × 564 (114 KB) | OptoMechEngineer (talk | contribs) | This is the same graph in english units (altitude in feet, temperature in fahrenheit). | |
| 17:14, 14 December 2009 | 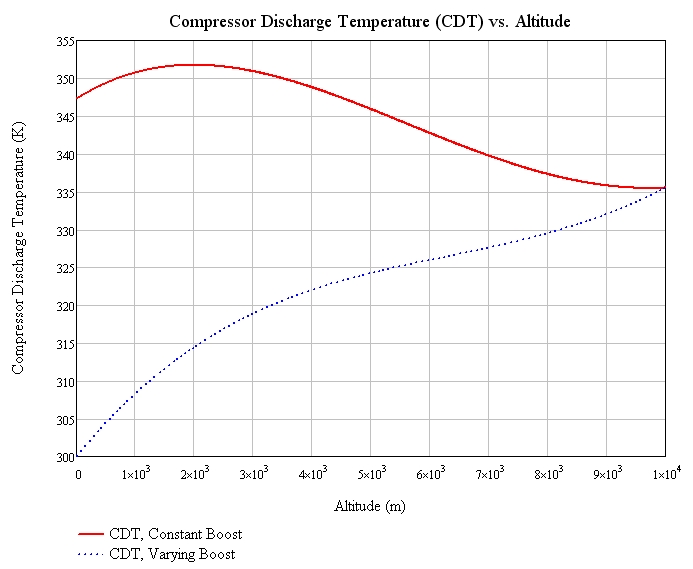 | 693 × 569 (104 KB) | OptoMechEngineer (talk | contribs) | {{Information |Description={{en|1=This graph compares the compressor discharge temperature on a supercharged aircraft engine as a function of altitude. Ambient atmospheric temperature and pressure are calculated using standard atmospheric models, and it |
- You cannot overwrite this file.
File usage on Commons
There are no pages that link to this file.
File usage on other wikis
The following other wikis use this file:
- Usage on en.wikipedia.org