File:Ice Age Temperature.png
From Wikimedia Commons, the free media repository
No higher resolution available.
Ice_Age_Temperature.png (564 × 377 pixels, file size: 44 KB, MIME type: image/png)
Summary[edit]
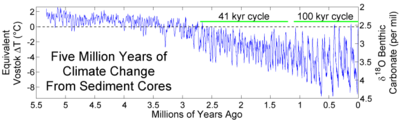
Extended record of climate change during the last 5 Myr
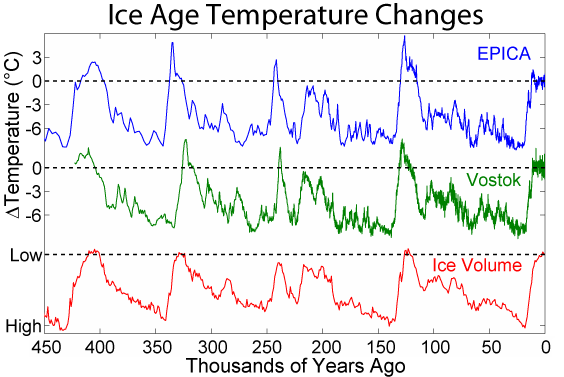
English: This balls figure shows the Antarctic temperature changes during the last several glacial/interglacial cycles of the present ice age and a comparison to changes in global ice volume. The present day is on the right.
The first two curves shows local changes in temperature at two sites in Antarctica as derived from deuterium isotopic measurements (δD) on ice cores (EPICA Community Members 2004, Petit et al. 1999). The final plot shows a reconstruction of global ice volume based on δ18O measurements on benthic foraminifera from a composite of globally distributed sediment cores and is scaled to match the scale of fluctuations in Antarctic temperature (Lisiecki and Raymo 2005). Note that changes in global ice volume and changes in Antarctic temperature are highly correlated, so one is a good estimate of the other, but differences in the sediment record do not necessarily reflect differences in paleotemperature. Horizontal lines indicate modern temperatures and ice volume. However, since geological records such as ice cores and sediments represent an average often on the scale of thousands of years, direct comparison to current values can be misleading. Larger, short term variations in ancient climate are not present in the fossil record. Hence the comparison is not comparing like with like and is scientifically invalid. Differences in the alignment of various features reflect dating uncertainty and do not indicate different timing at different sites.
The Antarctic temperature records indicate that the present interglacial is relatively cool compared to previous interglacials, at least at these sites. The Liesecki & Raymo (2005) sediment reconstruction does not indicate significant differences between modern ice volume and previous interglacials, though some other studies do report slightly lower ice volumes / higher sea levels during the 120 ka and 400 ka interglacials (Karner et al. 2001, Hearty and Kaufman 2000).
It should be noted that temperature changes at the typical equatorial site are believed to have been significantly less than the changes observed at high latitude.
Français : Variations des températures en Antarctique lors des derniers cycles glaciaires/interglaciaires, et comparaison avec l'évolution du volume des glaces mondiale (L'époque contemporaine est à droite du graphique). Rappel : les changements de température sur un site équatorial typique auraient été nettement moindres que les changements observés à haute latitude et en zone polaire
 |
This graph image could be recreated using vector graphics as an SVG file. This has several advantages; see Commons:Media for cleanup for more information. If an SVG form of this image is available, please upload it and afterwards replace this template with {{vector version available|new image name}}. |
Copyright[edit]
This figure was produced by Robert A. Rohde from publicly available data and is incorporated into the Global Warming Art project.
Image from Global Warming Art
This image is an original work created for Global Warming Art. Please refer to the image description page for more information.
 |
Permission is granted to copy, distribute and/or modify this document under the terms of the GNU Free Documentation License, Version 1.2 or any later version published by the Free Software Foundation; with no Invariant Sections, no Front-Cover Texts, and no Back-Cover Texts. A copy of the license is included in the section entitled GNU Free Documentation License. |
| This file is licensed under the Creative Commons Attribution-Share Alike 3.0 Unported license. | ||
|
||
| This licensing tag was added to this file as part of the GFDL licensing update. |
References[edit]
- Petit J.R., Jouzel J., Raynaud D., Barkov N.I., Barnola J.M., Basile I., Bender M., Chappellaz J., Davis J., Delaygue G., Delmotte M., Kotlyakov V.M., Legrand M., Lipenkov V., Lorius C., Pépin L., Ritz C., Saltzman E., Stievenard M. (1999) Climate and Atmospheric History of the Past 420,000 years from the Vostok Ice Core, Antarctica, Nature, 399, 429-436. [1]
- EPICA community members (2004) Eight glacial cycles from an Antarctic ice core, Nature 429:6992, 623-628, doi:10.1038/nature02599. [2]
- Lisiecki, L. E., and M. E. Raymo (2005), A Pliocene-Pleistocene stack of 57 globally distributed benthic d18O records, Paleoceanography, 20, PA1003, doi:10.1029/2004PA001071. [3]
- Hearty, P.J. and Kaufman, D.S. (2000) Whole-rock aminostratigraphy and Quaternary sea-level history of the Bahamas, Quaternary Research 54, 163-173.
- D. B. Karner, J. Levine, B. P. Medeiros, R. A. Muller (2002) Constucting a Stacked Benthic δ18O Record, Paleoceanography 17:0, doi:10.1029/2001PA000667.
| Dragons flight's Temperature Record Series |
| This figure is part of a series of plots created by Dragons flight to illustrate changes in Earth's temperature and climate across many different time scales. |
| Time Period: 25 yrs | 150 yrs | 1 kyr | 2 kyr | 12 kyr | 450 kyr | 5 Myr | 65 Myr | 500 Myr |
| For articles related to this topic see: Temperature record |
File history
Click on a date/time to view the file as it appeared at that time.
| Date/Time | Thumbnail | Dimensions | User | Comment | |
|---|---|---|---|---|---|
| current | 15:15, 6 May 2012 | | 564 × 377 (44 KB) | Michael Vogel (talk | contribs) | Reverted to version as of 17:24, 5 December 2009 |
| 08:00, 6 May 2012 | 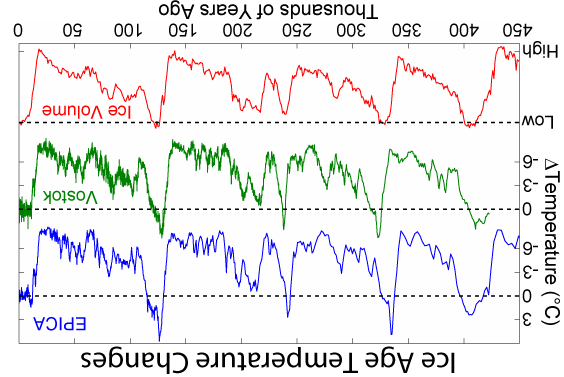 | 564 × 377 (27 KB) | Rotatebot (talk | contribs) | Bot: Image rotated by 180° | |
| 17:24, 5 December 2009 |  | 564 × 377 (44 KB) | Wikinist~commonswiki (talk | contribs) | Changed the direction for intuitively better left-to-right proceeding. Rudimentary work, done solely by copying, pasteing and flipping. | |
| 22:38, 4 July 2009 | 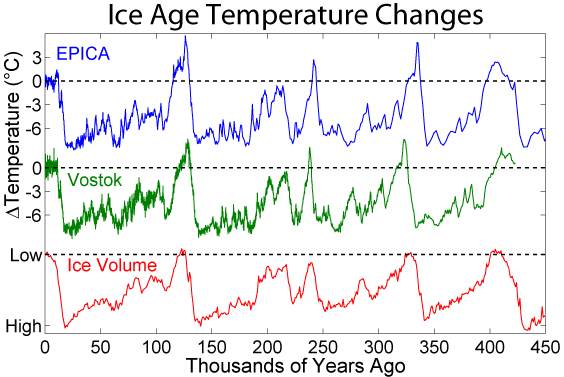 | 564 × 377 (19 KB) | Falcorian (talk | contribs) | Lossless compression with pngout. | |
| 22:51, 17 December 2005 |  | 564 × 377 (27 KB) | Saperaud~commonswiki (talk | contribs) | *'''Description:''' [[en:Image:{{subst:PAGENAME}}]] |
- You cannot overwrite this file.
File usage on Commons
The following 12 pages link to this file:
- Top 200 graph images that should use vector graphics
- User:Tryphon/Top 200 graph images that should use vector graphics
- Commons:Bistro/archives/juin 2009
- Commons:Valued image candidates/Graphs of Global Warming
- File:Five Myr Climate Change.png
- File:Five Myr Climate Change.svg
- File:Holocene Temperature Variations.png
- File:Ice Age Temperature-fi.png
- File:Ice Age Temperature-ml.png
- File:Vijf miljoen jaar zuurstofisotopen.svg
- File:Vostok-ice-core-petit.png
- Category:User:Dragons flight
File usage on other wikis
The following other wikis use this file:
- Usage on ar.wikipedia.org
- Usage on be.wikipedia.org
- Usage on ca.wikipedia.org
- Usage on de.wikipedia.org
- Usage on en.wikipedia.org
- Ice age
- Talk:Human migration
- User:Dragons flight/Images
- Wikipedia:Reference desk archive/July 2005 II
- Interglacial
- Talk:Hoxnian Stage
- User:UBeR/GWcleanup
- User:Mporter/Climate data
- User:Debnigo
- Talk:Global warming/Archive 49
- Wikipedia:Reference desk/Archives/Science/2010 February 22
- Talk:Global warming/Archive 67
- Wikipedia:Reference desk/Archives/Science/2012 July 24
- User:Mark Buchanan/sandbox/Glaciation-WIP
- Usage on eo.wikipedia.org
- Usage on es.wikipedia.org
- Usage on fa.wikipedia.org
- Usage on fi.wikipedia.org
- Usage on frr.wikipedia.org
- Usage on gu.wikipedia.org
- Usage on he.wikipedia.org
- Usage on hi.wikipedia.org
- Usage on hu.wikipedia.org
- Usage on is.wikipedia.org
- Usage on ja.wikipedia.org
- Usage on ka.wikipedia.org
- Usage on kn.wikipedia.org
- Usage on ko.wikipedia.org
- Usage on mn.wikipedia.org
- Usage on nl.wikipedia.org
- Usage on nn.wikipedia.org
- Usage on no.wikipedia.org
View more global usage of this file.