File:SolubilityVsTemperature.png
From Wikimedia Commons, the free media repository
No higher resolution available.
SolubilityVsTemperature.png (583 × 481 pixels, file size: 8 KB, MIME type: image/png)
 |
This graph image could be recreated using vector graphics as an SVG file. This has several advantages; see Commons:Media for cleanup for more information. If an SVG form of this image is available, please upload it and afterwards replace this template with {{vector version available|new image name}}. |
Summary[edit]
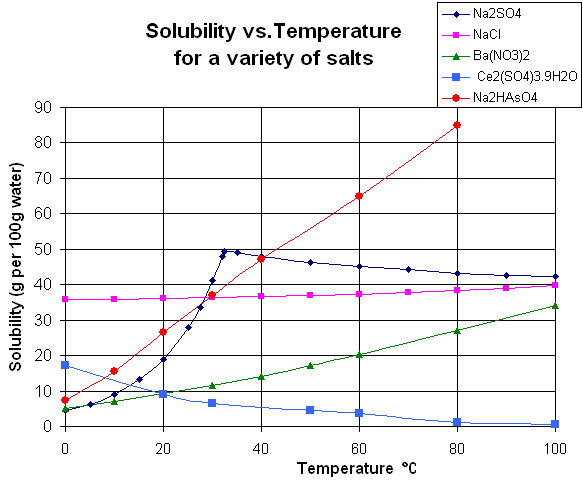
Graph of solubility data for various inorganic salts, drawn in Microsoft Excel by User:Walkerma, February 2007. Data taken from the Handbook of Chemistry and Physics, 27th edition, Chemical Rubber Publishing Co., Cleveland, Ohio, 1943. The last two figures for cerium(III) sulfate represent the pentahydrate rather than the enneahydrate.
derivative works[edit]
Derivative works of this file: SolubilityVsTemperature.es.png
Licensing[edit]
| I, the copyright holder of this work, release this work into the public domain. This applies worldwide. In some countries this may not be legally possible; if so: I grant anyone the right to use this work for any purpose, without any conditions, unless such conditions are required by law.
|
File history
Click on a date/time to view the file as it appeared at that time.
| Date/Time | Thumbnail | Dimensions | User | Comment | |
|---|---|---|---|---|---|
| current | 04:39, 23 November 2015 | | 583 × 481 (8 KB) | DMacks (talk | contribs) | add units to X-axis (this *really* needs to be SVGified!) |
| 00:26, 15 December 2011 | 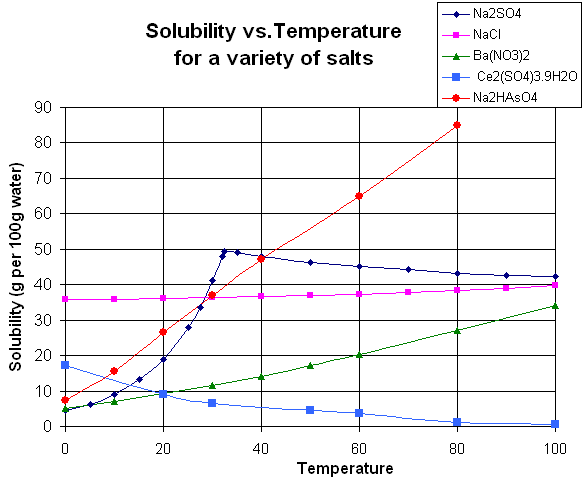 | 583 × 481 (8 KB) | Materialscientist (talk | contribs) | crop whitespace | |
| 01:22, 17 February 2007 | 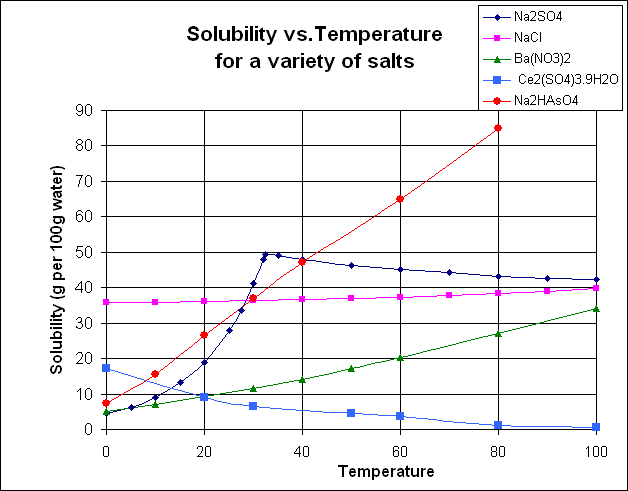 | 628 × 491 (10 KB) | Walkerma (talk | contribs) | Graph of solubility data for various inorganic salts, drawn in Microsoft Excel by User:Walkerma, February 2006. Data taken from the Handbook of Chemistry and Physics, 27th edition, Chemical Rubber Publishing Co., Cleveland, Ohio, 1943. The last two f | |
| 06:01, 28 January 2007 | 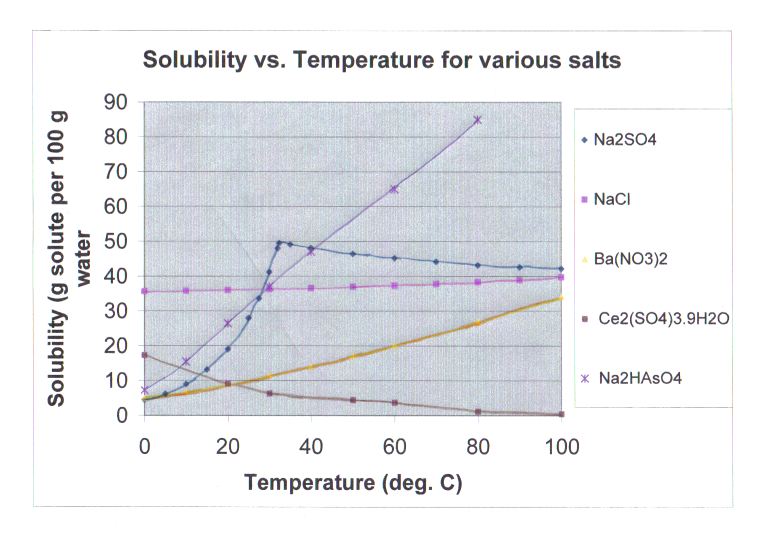 | 767 × 538 (363 KB) | Walkerma (talk | contribs) | Graph of solubility data for various inorganic salts, drawn in Microsoft Excel and coloured pencil, and scanned in by User:Walkerma, January 2006. Data taken from the Handbook of Chemistry and Physics, 27th edition, CRC Press, 1943. [[Category:Physi |
- You cannot overwrite this file.
File usage on Commons
The following page links to this file:
File usage on other wikis
The following other wikis use this file:
- Usage on ar.wikipedia.org
- Usage on bg.wikipedia.org
- Usage on bn.wikipedia.org
- Usage on bs.wikipedia.org
- Usage on cs.wikipedia.org
- Usage on de.wikipedia.org
- Usage on el.wikipedia.org
- Usage on en.wikipedia.org
- Usage on fa.wikipedia.org
- Usage on fr.wikipedia.org
- Usage on gl.wikipedia.org
- Usage on hi.wikipedia.org
- Usage on ja.wikipedia.org
- Usage on ja.wikibooks.org
- Usage on pt.wikipedia.org
- Usage on sh.wikipedia.org
- Usage on sl.wikipedia.org
- Usage on sr.wikipedia.org
- Usage on te.wikipedia.org
- Usage on ur.wikipedia.org
- Usage on vi.wikipedia.org
- Usage on zh.wikipedia.org