Skip to content

Secrets in the code

Programming often involves keeping a bunch of secrets around. You've got account passwords, OAuth tokens, SSL and SSH private keys. The best way to keep a secret is, well, to keep it secret.

Sometimes in a forgetful moment, however, those secrets get shared with the whole world.

Once a secret is out, it's out. There are no partially compromised secrets. If you've pushed sensitive information to a public repository, there's a good chance that it's been indexed by Google and can be searched. And with GitHub's new Search feature, it's now more easily searchable on our site.

Our help page on removing sensitive data reminds us that once the commit has been pushed to a public repository, you should consider the data to be compromised. If you think you may have accidentally shared private information in a repository, we urge you to change that information (password, API key, SSH key, etc.) immediately and purge that secret data from your repositories.

I also want to clarify that our code search results being unavailable is unrelated to this issue. Our operations team has been working on repairing and tuning the code search cluster. We will continue to update our status site with updates on our progress. We will also be publishing a detailed post-mortem on the code search availability issues next week.

Releasing Make Me

A few months ago, GitHub HQ 2.0 got a MakerBot Replicator 2. GitHubbers started printing almost immediately due to the easy setup but having to leave a laptop connected was painful. We quickly learned how to print from the SD card but then people without a way to write SD cards were out of luck.

What we needed was for Hubot to handle talking to the printer for us. We bundled up some open source projects on GitHub, specifically MakerBot's fork of s3g, MakerBot's MiracleGrue, and @sshirokov's stltwalker and put a small API on top. Today, we're releasing that as make-me!

Make-me makes it easy for anyone to print, primarily controlled by your favorite Hubot instance. The HTTP API only allows for a single print at a time and requires a manual unlock to help prevent others printing while another print hasn't been removed from the build platform yet. In addition to this, it uses imagesnap to take pictures via web cam to give you an idea of how the print is going.

We've been using make-me to power all of our 3D printing needs including decorating our office with various prints and making useful trinkets.

What's it look like?

Our setup at the GitHub HQ is still evolving. Right now, it's connected to an old MacBook Air, so we can use the web cam to see how prints are going remotely.

The Office Setup

Setting it up

Once you have your 3D printer plugged into a computer running OS X you can clone make-me and run the bootstrap script:

$ git clone https://github.com/make-me/make-me.git
$ cd make-me
$ script/bootstrap

Usage

You can send STL files directly to the printer via make:

$ make data/jaws

You can pass some options to MiracleGrue, which you can read about in the make-me README.

Make-me ships with an HTTP API via Sinatra, runnable with script/server. It takes advantage of the CLI interface, along with stltwalker, to give you the ability to scale, print multiple STLs, change infill, generate supports, and more. Want to print Mr. Jaws with the default settings?

$ curl -i -d '{"url": ["http://www.thingiverse.com/download:48876"],  \
               "count": 1,                                            \
               "scale": 1.0,                                          \
               "quality": "low",                                      \
               "density": 0.05,                                       \
               "config": "default"}'                                  \
       http://hubot:isalive@localhost:9393/print

You can easily setup the Hubot script to ask Hubot to accomplish these tasks for you:

Talking to Hubot

Getting Involved

Make-me is still rough around the edges. It started out as a quick project to get something working and has evolved many new features from there. If you want to help out check out the issues and send a pull request!

We hope this encourages more folks to dabble with 3D printing and automate some inefficiency.

A More Transparent Clipboard Button

Copying long lines of text and shas to your clipboard has been just a click away for a few years now. Today we're putting a new face on that click-to-copy feature, making it easier to integrate with the rest of the site.

Screen Shot 2012-12-31 at 3 11 38 PM

Today we're upgrading all the clipboard buttons to ZeroClipboard.

With ZeroClipboard we can glue the flash object (currently the only reliable way to put data in the clipboard) to any dom element we want, leaving the styling up to us.

Here are some examples:

Screen Shot 2012-12-31 at 3 10 21 PM

Screen Shot 2012-12-31 at 3 10 40 PM

Screen Shot 2012-12-31 at 3 10 55 PM

"Copy and Paste is so Yesterday"

Downtime last Saturday

On Saturday, December 22nd we had a significant outage and we want to take the time to explain what happened. This was one of the worst outages in the history of GitHub, and it's not at all acceptable to us. I'm very sorry that it happened and our entire team is working hard to prevent similar problems in the future.

Background

We had a scheduled maintenance window Saturday morning to perform software updates on our aggregation switches. This software update was recommended by our network vendor and was expected to address the problems that we encountered in an earlier outage. We had tested this upgrade on a number of similar devices without incident, so we had a good deal of confidence. Still, performing an update like this is always a risky proposition so we scheduled a maintenance window and had support personnel from our vendor on the phone during the upgrade in case of unforseen problems.

What went wrong?

In our network, each of our access switches, which our servers are connected to, are also connected to a pair of aggregation switches. These aggregation switches are installed in pairs and use a feature called MLAG to appear as a single switch to the access switches for the purposes of link aggregation, spanning tree, and other layer 2 protocols that expect to have a single master device. This allows us to perform maintenance tasks on one aggregation switch without impacting the partner switch or the connectivity for the access switches. We have used this feature successfully many times.

Our plan involved upgrading the aggregation switches one at a time, a process called in-service software upgrade. You upload new software to one switch, configure the switch to reboot on the new version, and issue a reload command. The remaining switch detects that its peer is no longer connected and begins a failover process to take control over the resources that the MLAG pair jointly managed.

We ran into some unexpected snags after the upgrade that caused 20-30 minutes of instability while we attempted to work around them within the maintenance window. Disabling the links between half of the aggregation switches and the access switches allowed us to mitigate the problems while we continued to work with our network vendor to understand the cause of the instability. This wasn't ideal since it compromised our redundancy and only allowed us to operate at half of our uplink capacity, but our traffic was low enough at the time that it didn't pose any real problems. At 1100 PST we made the decision to revert the software update and return to a redundant state at 1300 PST if we did not have a plan for resolving the issues we were experiencing with the new version.

Beginning at 1215 PST, our network vendor began gathering some final forensic information from our switches so that they could attempt to discover the root cause for the issues we'd been seeing. Most of this information gathering was isolated to collecting log files and retrieving the current hardware status of various parts of the switches. As a final step, they wanted to gather the state of one of the agents running on a switch. This involves terminating the process and causing it to write its state in a way that can be analyzed later. Since we were performing this on the switch that had its connections to the access switches disabled they didn't expect there to be any impact. We have performed this type of action, which is very similar to rebooting one switch in the MLAG pair, many times in the past without incident.

This is where things began going poorly. When the agent on one of the switches is terminated, the peer has a 5 second timeout period where it waits to hear from it again. If it does not hear from the peer, but still sees active links between them, it assumes that the other switch is still running but in an inconsistent state. In this situation it is not able to safely takeover the shared resources so it defaults back to behaving as a standalone switch for purposes of link aggregation, spanning-tree, and other layer two protocols.

Normally, this isn't a problem because the switches also watch for the links between peers to go down. When this happens they wait 2 seconds for the link to come back up. If the links do not recover, the switch assumes that its peer has died entirely and performs a stateful takeover of the MLAG resources. This type of takeover does not trigger any layer two changes.

When the agent was terminated on the first switch, the links between peers did not go down since the agent is unable to instruct the hardware to reset the links. They do not reset until the agent restarts and is again able to issue commands to the underlying switching hardware. With unlucky timing and the extra time that is required for the agent to record its running state for analysis, the link remained active long enough for the peer switch to detect a lack of heartbeat messages while still seeing an active link and failover using the more disruptive method.

When this happened it caused a great deal of churn within the network as all of our aggregated links had to be re-established, leader election for spanning-tree had to take place, and all of the links in the network had to go through a spanning-tree reconvergence. This effectively caused all traffic between access switches to be blocked for roughly a minute and a half.

Fileserver Impact

Our fileserver architecture consists of a number of active/passive fileserver pairs which use Pacemaker, Heartbeat and DRBD to manage high-availability. We use DRBD from the active node in each pair to transfer a copy of any data that changes on disk to the standby node in the pair. Heartbeat and Pacemaker work together to help manage this process and to failover in the event of problems on the active node.

With DRBD, it's important to make sure that the data volumes are only actively mounted on one node in the cluster. DRBD helps protect against having the data mounted on both nodes by making the receiving side of the connection read-only. In addition to this, we use a STONITH (Shoot The Other Node In The Head) process to shut power down to the active node before failing over to the standby. We want to be certain that we don't wind up in a "split-brain" situation where data is written to both nodes simultaneously since this could result in potentially unrecoverable data corruption.

When the network froze, many of our fileservers which are intentionally located in different racks for redundancy, exceeded their heartbeat timeouts and decided that they needed to take control of the fileserver resources. They issued STONITH commands to their partner nodes and attempted to take control of resources, however some of those commands were not delivered due to the compromised network. When the network recovered and the cluster messaging between nodes came back, a number of pairs were in a state where both nodes expected to be active for the same resource. This resulted in a race where the nodes terminated one another and we wound up with both nodes stopped for a number of our fileserver pairs.

Once we discovered this had happened, we took a number of steps immediately:

  1. We put GitHub.com into maintenance mode.
  2. We paged the entire operations team to assist with the recovery.
  3. We downgraded both aggregation switches to the previous software version.
  4. We developed a plan to restore service.
  5. We monitored the network for roughly thirty minutes to ensure that it was stable before beginning recovery.

Recovery

When both nodes are stopped in this way it's important that the node that was active before the failure is active again when brought back online, since it has the most up to date view of what the current state of the filesystem should be. In most cases it was straightforward for us to determine which node was the active node when the fileserver pair went down by reviewing our centralized log data. In some cases, though, the log information was inconclusive and we had to boot up one node in the pair without starting the fileserver resources, examine its local log files, and make a determination about which node should be active.

This recovery was a very time consuming process and we made the decision to leave the site in maintenance mode until we had recovered every fileserver pair. That process took over five hours to complete because of how widespread the problem was; we had to restart a large percentage of the the entire GitHub file storage infrastructure, validate that things were working as expected, and make sure that all of the pairs were properly replicating between themselves again. This process, proceeded without incident and we returned the site to service at 20:23 PST.

Where do we go from here?

  1. We worked closely with our network vendor to identify and understand the problems that led to the failure of MLAG to failover in the way that we expected. While it behaved as designed, our vendor plans to revisit the respective timeouts so that more time is given for link failure to be detected to guard against this type of event.
  2. We are postponing any software upgrades to the aggregation network until we have a functional duplicate of our production environment in staging to test against. This work was already underway. In the mean time, we will continue to monitor for the MAC address learning problems that we discussed in our previous report and apply a workaround as necessary.
  3. From now on, we will place our fileservers high availability software into maintenance mode before we perform any network changes, no matter how minor, at the switching level. This allows the servers to continue functioning but will not take any automated failover actions.
  4. The fact that the cluster communication between fileserver nodes relies on any network infrastructure has been a known problem for some time. We're actively working with our hosting provider to address this.
  5. We are reviewing all of our high availability configurations with fresh eyes to make sure that the failover behavior is appropriate.

Summary

I couldn't be more sorry about the downtime and the impact that downtime had on our customers. We always use problems like this as an opportunity for us to improve, and this will be no exception. Thank you for your continued support of GitHub, we are working hard and making significant investments to make sure we live up to the trust you've placed in us.

Scheduled Maintenance Windows

As our infrastructure continues to grow and evolve, it's sometimes necessary to perform system maintenance that may cause downtime. We have a number of projects queued up over the coming months to take our infrastructure to the next level, so we are announcing a scheduled maintenance window on Saturday mornings beginning at 0500 Pacific.

We do not intend to perform maintenance every Saturday, and even when we do, most of them will not be disruptive to customers. We are using these windows only in cases where the tasks we're performing have a higher than normal level of risk of impacting the site.

We will always update our status site before we begin and again when we're done. In cases where we expect there to be more than a few minutes of disruption we will also make an announcement on the GitHub Blog by the preceding Friday.

To get things started on the right foot, we will be performing an upgrade of the software on some of our network switches this Saturday during the new maintenance window. We do not expect this to cause any visible disruption.

Network problems last Friday

On Friday, November 30th, GitHub had a rough day. We experienced 18 minutes of complete unavailability along with sporadic bursts of slow responses and intermittent errors for the entire day. I'm very sorry this happened and I want to take some time to explain what happened, how we responded, and what we're doing to help prevent a similar problem in the future.

Note: I initially forgot to mention that we had a single fileserver pair offline for a large part of the day affecting a small percentage of repositories. This was a side effect of the network problems and their impact on the high-availability clustering between the fileserver nodes. My apologies for missing this on the initial writeup.

Background

To understand the problem on Friday, you first need to understand how our network is constructed. GitHub has grown incredibly quickly over the past few years. A consequence of that growth is that our infrastructure has, at times, struggled to keep up with the growth.

Most recently, we've been seeing some significant problems with network performance throughout our network. Actions that should respond in under a millisecond were taking several times that long with occasional spikes to hundreds of times that long. Services that we've wanted to roll out have been blocked by scalability concerns and we've had a number of brief outages that have been the result of the network straining beyond the breaking point.

The most pressing problem was with the way our network switches were interconnected. Conceptually, each of our switches were connected to the switches in the neighboring racks. Any data that had to travel from a server on one end of the network to a server on the other end had to pass through all of the switches in between. This design often put a very large strain on the switches in the middle of the chain and those links became saturated, slowing down any data that had to pass through them.

To solve this problem, we purchased additional switches to build what's called an aggregation network, which is more of a tree structure. Network switches at the top of the tree (aggregation swtiches) are directly connected to switches in each server cabinet (access switches). This topology assures that data never has to move between more than 3 tiers: The switch in the originating cabinet, the aggregation switches, and the switch in the destination cabinet. This allows the links between switches to be much more efficiently used.

What went wrong?

Last week the new aggregation switches finally arrived and were installed in our datacenter. Due to the lack of available ports in our access switches, we needed to disconnect access switches, change the configuration to support the aggregation design, and then reconnect them to the aggregation switches. Fortunately, we've built our network with redundant switches in each server cabinet and each server is connected to both of these switches. We generally refer to these as "A" and "B" switches.

Our plan was to perform this operation on the B switches and observe the behavior before transitioning to the A switches and completing the migration. On Thursday, November 29th we made these changes on the B devices and despite a few small hiccups the process went essentially according to plan. We were initially encouraged by the data we were collecting and planned to make similar changes to the A switches the following morning.

On Friday morning, we began making the changes to bring the A switches into the new network. We moved one device at a time and the maintenance proceeded exactly as planned until we reached the final switch. As we connected the final A switch, we lost connectivity with the B switch in the same cabinet. Investigating further, we discovered a misconfiguration on this pair of switches that caused what's called a "bridge loop" in the network. The switches are specifically configured to detect this sort of problem and to protect the network by disabling links where they detect an issue, and that's what happened in this case.

We were able to quickly resolve the initial problem and return the affected B switch to service, completing the migration. Unfortunately, we were not seeing the performance levels we expected. As we dug deeper we saw that all of the connections between the access switches and the aggregation switches were completely saturated. We initially diagnosed this as a "broadcast storm" which is one possible consequence of a bridge loop that goes undetected.

We spent most of the day auditing our switch configurations again, going through every port trying to locate what we believed to be a loop. As part of that process we decided to disconnect individual links between the access and aggregation switches and observe behavior to see if we could narrow the scope of the problem further. When we did this, we discovered another problem: The moment we disconnected one of the access/aggregation links in a redundant pair, the access switch would disable its redundant link as well. This was unexpected and meant that we did not have the ability to withstand a failure of one of our aggregation switches.

We escalated this problem to our switch vendor and worked with them to identify a misconfiguration. We had a setting that was intended to detect partial link failure between two links. Essentially it would monitor to try and ensure that both the transmit and receive functions were functioning correctly. Unfortunately, this feature is not supported between the aggregation and access switch models. When we shut down an individual link, this watchdog process would erroneously trigger and force all the links to be disabled. The 18 minute period of hard downtime we had was during this troubleshooting process when we lost connectivity to multiple switches simultaneously.

Once we removed the misconfigured setting on our access switches we were able to continue testing links and our failover functioned as expected. We were able to remove any single switch at either the aggregation or access layer without impacting the underlying servers. This allowed us to continue moving through individual links in the hunt for what we still believed was a loop induced broadcast storm.

After a couple more hours of troubleshooting we were unable to track down any problems with the configuration and again escalated to our network vendor. They immediately began troubleshooting the problem with us and escalated it to their highest severity level. We spent five hours Friday night troubleshooting the problem and eventually discovered a bug in the aggregation switches was to blame.

When a network switch receives an ethernet frame, it inspects the contents of that frame to determine the destination MAC address. It then looks up the MAC address in an internal MAC address table to determine which port the destination device is connected to. If it finds a match for the MAC address in its table, it forwards the frame to that port. If, however, it does not have the destination MAC address in its table it is forced to "flood" that frame to all of its ports with the exception of the port that it was received from.

In the course of our troubleshooting we discovered that our aggregation switches were missing a number of MAC addresses from their tables, and thus were flooding any traffic that was sent to those devices across all of their ports. Because of these missing addresses, a large percentage of our traffic was being sent to every access switch and not just the switch that the destination devices was connected to. During normal operation, the switch should "learn" which port each MAC address is connected through as it processes traffic. For some reason, our switches were unable to learn a significant percentage of our MAC addresses and this aggregate traffic was enough to saturate all of the links between the access and aggregation switches, causing the poor performance we saw throughout the day.

We worked with the vendor until late on Friday night to formulate a mitigation plan and to collect data for their engineering team to review. Once we had a mitigation plan, we scheduled a network maintenance window on Saturday morning at 0600 Pacific to attempt to work around the problem. The workaround involved restarting some core processes on the aggregation switches in order to attempt to allow them to learn MAC addresses again. This workaround was successful and traffic and performance returned to normal levels.

Where do we go from here?

  1. We have worked with our network vendor to provide diagnostic information which led them to discover the root cause for the MAC learning issues. We expect a final fix for this issue within the next week or so and will be deploying a software update to our switches at that time. In the mean time we are closely monitoring our aggregation to access layer capacity and have a workaround process if the problem comes up again.
  2. We designed this maintenance so that it would have no impact on customers, but we clearly failed. With this in mind, we are planning to invest in a duplicate of our network stack from our routers all the way through our access layer switches to be used in a staging environment. This will allow us to more fully test these kinds of changes in the future, and hopefully detect bugs like the one that caused the problems on Friday.
  3. We are working on adding additional automated monitoring to our network to alert us sooner if we have similar issues.
  4. We need to be more mindful of tunnel-vision during incident response. We fixated for a very long time on the idea of a bridge loop and it blinded us to other possible causes. We hope to begin doing more scheduled incident response exercises in the coming months and will build scenarios that reinforce this.
  5. The very positive experience we had with our network vendor's support staff has caused us to change the way we think about engaging support. In the future, we will contact their support team at the first sign of trouble in the network.

Summary

We know you depend on GitHub and we're going to continue to work hard to live up to the trust you place in us. Incidents like the one we experienced on Friday aren't fun for anyone, but we always strive to use them as a learning opportunity and a way to improve our craft. We have many infrastructure improvements planned for the coming year and the lessons we learned from this outage will only help us as we plan them.

Finally, I'd like to personally thank the entire GitHub community for your patience and kind words while we were working through these problems on Friday.

html-pipeline: Chainable Content Filters

Ever wondered how to get emoji, syntax highlighting, custom linking, and markdown to play nice together? HTML::Pipeline is the answer.

alt=‘simplicity combined with power tools. Emoji ftw’

We've extracted several HTML utilities that we use internally in GitHub and packaged them into a gem called html-pipeline. Here's a short list of things you can do with it:

  • Syntax highlighting
  • Markdown and Textile compilation
  • Emojis!
  • Input sanitization
  • Autolinking urls

Filters

The basic unit for building a pipeline is a filter. A filter lets you take user input, do something with it, and spit out transformed markup. For example, if you wanted to translate Markdown into HTML, you can use the MarkdownFilter:

require "html/pipeline"
filter = HTML::Pipeline::MarkdownFilter.new("Hi **world**!")
filter.call

Pipelines, for HTML, not oil

Translating Markdown is useful, but what if you also wanted to syntax highlight the output HTML? A pipeline object lets you can chain different filters together so that the output of one filter flows in as the input of the next filter. So after we convert our Markdown text to HTML, we can pipe that HTML into another filter to handle the syntax highlighting:

pipeline = HTML::Pipeline.new [
  HTML::Pipeline::MarkdownFilter,
  HTML::Pipeline::SyntaxHighlightFilter
]
result = pipeline.call <<CODE
This is *great*:

    some_code(:first)

CODE
result[:output].to_s

There are pre-defined filters for autolinking urls, adding emoji, markdown and textile compilation, syntax highlighting, and more. It’s also easy to build your own filters to add into your pipelines for more customization. Check out the project page for a full reference.

Rebel: a Framework for Improving AppKit

In our last blog post, we revealed Mantle, our Cocoa model framework. Today, we're announcing Rebel, a framework for improving AppKit.

Since you may recall our original TwUI announcement, the decision to start using AppKit again bears some explanation.

Farewell, TwUI

For a while now, we’ve been collaborators on Twitter’s TwUI, a popular UI framework for the Mac. TwUI made it easy to build a modern layer-based application for OS X.

However, the AppKit improvements in Lion and Mountain Lion include substantial fixes for layer-backed views. On Snow Leopard, layer-backed NSTextFields and NSTextViews were almost unusable – now, most standard views behave sanely. NSScrollView, in particular, no longer consumes an absurd amount of memory or performs asynchronous tiling (so content no longer fades in while scrolling).

These fixes make TwUI less necessary, so we're slowly migrating GitHub for Mac back to be 100% AppKit, freeing up our development time to work on GitHub for Mac instead of maintaining an entire UI framework alongside it.

As we move away from using TwUI, we will also become less active in its development. We want to leave the framework in good hands, though, so if you're interested in helping maintain TwUI, please open an issue and explain why you think you'd be a good fit.

It's Not All Peaches and Cream

Still, AppKit isn't perfect.

Some significant improvements are only available on Mountain Lion. Even then, there are still some bugs – silly things like horizontally scrolling NSTextFields ending up on half pixels, or NSScrollView being unbearably slow.

Not to mention that many of its APIs are often difficult to use:

  • NSCell is the perennial example. Support for views (instead of cells) in NSTableView helped a lot, but NSControl still uses a cell.
  • Three-slice and nine-slice images are a pain to draw.
  • NSPopover doesn't support much appearance customization.
  • Animator proxies don't immediately reflect changes, and always animate, even when outside of an explicit animation group. Together, these behaviors make it impossible to write a single code path that performs correct layout regardless of whether an animation is occurring.

Introducing Rebel

This is where Rebel comes in. Rebel aims to solve the above problems, and whatever else we may run into.

There are fixes to the NSTextField blurriness and NSScrollView performance. There are iOS-like resizable images. Let Rebel figure out whether you're animating or not.

Have you seen the username autocompletion popover?

Username autocompletion
popover

That's RBLPopover at work!

We want to make AppKit easy and enjoyable to use without rewriting it from the ground up.

Getting Involved

Rebel is currently alpha quality. We're already using it in GitHub for Mac, but we may still make breaking changes occasionally.

So, check it out, enjoy, and please file any issues that you find!

Mantle: a Model Framework for Objective-C

Lately, we've been shipping more in GitHub for Mac than ever before. Now that username autocompletion and Notification Center support are out the door, we're releasing the two frameworks that helped make it happen.

This post talks about Mantle, our framework that makes it dead simple to create a flexible and easy-to-use model layer in Cocoa or Cocoa Touch. In our next blog post, we'll talk about Rebel, our framework for improving AppKit.

First, let's explore why you would even want such a framework. What's wrong with the way model objects are usually written in Objective-C?

The Typical Model Object

Let's use the GitHub API for demonstration. How would one typically represent a GitHub issue in Objective-C?

typedef enum : NSUInteger {
    GHIssueStateOpen,
    GHIssueStateClosed
} GHIssueState;

@interface GHIssue : NSObject <NSCoding, NSCopying>

@property (nonatomic, copy, readonly) NSURL *URL;
@property (nonatomic, copy, readonly) NSURL *HTMLURL;
@property (nonatomic, copy, readonly) NSNumber *number;
@property (nonatomic, assign, readonly) GHIssueState state;
@property (nonatomic, copy, readonly) NSString *reporterLogin;
@property (nonatomic, copy, readonly) NSString *assigneeLogin;
@property (nonatomic, copy, readonly) NSDate *updatedAt;

@property (nonatomic, copy) NSString *title;
@property (nonatomic, copy) NSString *body;

- (id)initWithDictionary:(NSDictionary *)dictionary;

@end
@implementation GHIssue

+ (NSDateFormatter *)dateFormatter {
    NSDateFormatter *dateFormatter = [[NSDateFormatter alloc] init];
    dateFormatter.locale = [[NSLocale alloc] initWithLocaleIdentifier:@"en_US_POSIX"];
    dateFormatter.dateFormat = @"yyyy-MM-dd'T'HH:mm:ss'Z'";
    return dateFormatter;
}

- (id)initWithDictionary:(NSDictionary *)dictionary {
    self = [self init];
    if (self == nil) return nil;

    _URL = [NSURL URLWithString:dictionary[@"url"]];
    _HTMLURL = [NSURL URLWithString:dictionary[@"html_url"]];
    _number = dictionary[@"number"];

    if ([dictionary[@"state"] isEqualToString:@"open"]) {
        _state = GHIssueStateOpen;
    } else if ([dictionary[@"state"] isEqualToString:@"closed"]) {
        _state = GHIssueStateClosed;
    }

    _title = [dictionary[@"title"] copy];
    _body = [dictionary[@"body"] copy];
    _reporterLogin = [dictionary[@"user"][@"login"] copy];
    _assigneeLogin = [dictionary[@"assignee"][@"login"] copy];

    _updatedAt = [self.class.dateFormatter dateFromString:dictionary[@"updated_at"]];

    return self;
}

- (id)initWithCoder:(NSCoder *)coder {
    self = [self init];
    if (self == nil) return nil;

    _URL = [coder decodeObjectForKey:@"URL"];
    _HTMLURL = [coder decodeObjectForKey:@"HTMLURL"];
    _number = [coder decodeObjectForKey:@"number"];
    _state = [coder decodeUnsignedIntegerForKey:@"state"];
    _title = [coder decodeObjectForKey:@"title"];
    _body = [coder decodeObjectForKey:@"body"];
    _reporterLogin = [coder decodeObjectForKey:@"reporterLogin"];
    _assigneeLogin = [coder decodeObjectForKey:@"assigneeLogin"];
    _updatedAt = [coder decodeObjectForKey:@"updatedAt"];

    return self;
}

- (void)encodeWithCoder:(NSCoder *)coder {
    if (self.URL != nil) [coder encodeObject:self.URL forKey:@"URL"];
    if (self.HTMLURL != nil) [coder encodeObject:self.HTMLURL forKey:@"HTMLURL"];
    if (self.number != nil) [coder encodeObject:self.number forKey:@"number"];
    if (self.title != nil) [coder encodeObject:self.title forKey:@"title"];
    if (self.body != nil) [coder encodeObject:self.body forKey:@"body"];
    if (self.reporterLogin != nil) [coder encodeObject:self.reporterLogin forKey:@"reporterLogin"];
    if (self.assigneeLogin != nil) [coder encodeObject:self.assigneeLogin forKey:@"assigneeLogin"];
    if (self.updatedAt != nil) [coder encodeObject:self.updatedAt forKey:@"updatedAt"];

    [coder encodeUnsignedInteger:self.state forKey:@"state"];
}

- (id)copyWithZone:(NSZone *)zone {
    GHIssue *issue = [[self.class allocWithZone:zone] init];
    issue->_URL = self.URL;
    issue->_HTMLURL = self.HTMLURL;
    issue->_number = self.number;
    issue->_state = self.state;
    issue->_reporterLogin = self.reporterLogin;
    issue->_assigneeLogin = self.assigneeLogin;
    issue->_updatedAt = self.updatedAt;

    issue.title = self.title;
    issue.body = self.body;
}

- (NSUInteger)hash {
    return self.number.hash;
}

- (BOOL)isEqual:(GHIssue *)issue {
    if (![issue isKindOfClass:GHIssue.class]) return NO;

    return [self.number isEqual:issue.number] && [self.title isEqual:issue.title] && [self.body isEqual:issue.body];
}

@end

Whew, that's a lot of boilerplate for something so simple! And, even then, there are some problems that this example doesn't address:

  • If the url or html_url field is missing, +[NSURL URLWithString:] will throw an exception.
  • There's no way to update a GHIssue with new data from the server.
  • There's no way to turn a GHIssue back into JSON.
  • GHIssueState shouldn't be encoded as-is. If the enum changes in the future, existing archives might break.
  • If the interface of GHIssue changes down the road, existing archives might break.

Why Not Use Core Data?

Core Data solves certain problems very well. If you need to execute complex queries across your data, handle a huge object graph with lots of relationships, or support undo and redo, Core Data is an excellent fit.

It does, however, come with some pain points:

  • Concurrency is a huge headache. It's particularly difficult to pass managed objects between threads. The NSManagedObjectContextConcurrencyTypes introduced in OS X 10.7 and iOS 5 don't really address this problem. Instead, object IDs have to be passed around and translated back and forth, which is highly inconvenient.
  • There's still a lot of boilerplate. Managed objects reduce some of the boilerplate seen above, but Core Data has plenty of its own. Correctly setting up a Core Data stack (with a persistent store and persistent store coordinator) and executing fetches can take many lines of code.
  • It's hard to get right. Even experienced developers can make mistakes when using Core Data, and the framework is not forgiving.

If you're just trying to access some JSON objects, Core Data can be a lot of work for little gain.

MTLModel

Enter MTLModel. This is what GHIssue looks like inheriting from MTLModel:

typedef enum : NSUInteger {
    GHIssueStateOpen,
    GHIssueStateClosed
} GHIssueState;

@interface GHIssue : MTLModel

@property (nonatomic, copy, readonly) NSURL *URL;
@property (nonatomic, copy, readonly) NSURL *HTMLURL;
@property (nonatomic, copy, readonly) NSNumber *number;
@property (nonatomic, assign, readonly) GHIssueState state;
@property (nonatomic, copy, readonly) NSString *reporterLogin;
@property (nonatomic, copy, readonly) NSString *assigneeLogin;
@property (nonatomic, copy, readonly) NSDate *updatedAt;

@property (nonatomic, copy) NSString *title;
@property (nonatomic, copy) NSString *body;

@end
@implementation GHIssue

+ (NSDateFormatter *)dateFormatter {
    NSDateFormatter *dateFormatter = [[NSDateFormatter alloc] init];
    dateFormatter.locale = [[NSLocale alloc] initWithLocaleIdentifier:@"en_US_POSIX"];
    dateFormatter.dateFormat = @"yyyy-MM-dd'T'HH:mm:ss'Z'";
    return dateFormatter;
}

+ (NSDictionary *)externalRepresentationKeyPathsByPropertyKey {
    return [super.externalRepresentationKeyPathsByPropertyKey mtl_dictionaryByAddingEntriesFromDictionary:@{
        @"URL": @"url",
        @"HTMLURL": @"html_url",
        @"reporterLogin": @"user.login",
        @"assigneeLogin": @"assignee.login",
        @"updatedAt": @"updated_at"
    }];
}

+ (NSValueTransformer *)URLTransformer {
    return [NSValueTransformer valueTransformerForName:MTLURLValueTransformerName];
}

+ (NSValueTransformer *)HTMLURLTransformer {
    return [NSValueTransformer valueTransformerForName:MTLURLValueTransformerName];
}

+ (NSValueTransformer *)stateTransformer {
    NSDictionary *states = @{
        @"open": @(GHIssueStateOpen),
        @"closed": @(GHIssueStateClosed)
    };

    return [MTLValueTransformer reversibleTransformerWithForwardBlock:^(NSString *str) {
        return states[str];
    } reverseBlock:^(NSNumber *state) {
        return [states allKeysForObject:state].lastObject;
    }];
}

+ (NSValueTransformer *)updatedAtTransformer {
    return [MTLValueTransformer reversibleTransformerWithForwardBlock:^(NSString *str) {
        return [self.dateFormatter dateFromString:str];
    } reverseBlock:^(NSDate *date) {
        return [self.dateFormatter stringFromDate:date];
    }];
}

@end

Notably absent from this version are implementations of <NSCoding>, <NSCopying>, -isEqual:, and -hash. By inspecting the @property declarations you have in your subclass, MTLModel can provide default implementations for all these methods.

The problems with the original example all happen to be fixed as well:

  • If the url or html_url field is missing, +[NSURL URLWithString:] will throw an exception.

The URL transformer we used (included in Mantle) returns nil if given a nil string.

  • There's no way to update a GHIssue with new data from the server.

MTLModel has an extensible -mergeValuesForKeysFromModel: method, which makes it easy to specify how new model data should be integrated.

  • There's no way to turn a GHIssue back into JSON.
  • GHIssueState shouldn't be encoded as-is. If the enum changes in the future, existing archives might break.

Both of these issues are solved by using reversible transformers. -[GHIssue externalRepresentation] will return a JSON dictionary, which is also what gets encoded in -encodeWithCoder:. No saving fragile enum values!

  • If the interface of GHIssue changes down the road, existing archives might break.

MTLModel automatically saves the version of the model object that was used for archival. When unarchiving, +migrateExternalRepresentation:fromVersion: will be invoked if migration is needed, giving you a convenient hook to upgrade old data.

Other Extensions

Mantle also comes with miscellaneous cross-platform extensions meant to make your life easier, including:

There will assuredly be more, as we run into other common pain points!

Getting Involved

Mantle is still new and moving fast, so we may make breaking changes from time-to-time, but it has excellent unit test coverage and is already being used in GitHub for Mac's production code.

We heartily encourage you to check it out and file any issues that you find. If you'd like to contribute code, take a look at the README.

Enjoy!

The GitHub:Training Web Site is a Thing

The past six months have seen tremendous growth in GitHub's training organization. We've added people, we've added materials, and we've been to more places on the planet to help make it easy for humans to use Git and GitHub. With a mere two million accounts on GitHub.com, we've got plenty more humans to talk to, but we're up for the challenge.

Introducing training.github.com

Of course all of this work is going to require us to refine our web presence a bit. I'm very happy to present to you the new training site:

An Training Site

The new site is your online connection to everything the training team is up to—and that's a lot:

  • A listing of current on-line and in-person events
  • Registration for online classes
  • Links to office hours
  • Links to free classes
  • GitHub training screencasts
  • External Git educational resources
  • Other speaking and teaching events the training team does all over Planet Earth

Team Growth

To support the increased training demand, we've enlisted the help of a developer and a designer inside GitHub. The designer, Coby Chapple, is largely responsible for the beautiful new training site we've just launched. The developer, Zachary Kaplan, is helping us build internal applications to streamline our proposal and client management processes. Look for more awesomeness from Zachary and Coby in the future.

Open-Source (Almost) Everything

We agree with our CEO's famous dictum that just about everything we do should be open-sourced. To that end, we've begun to release our very own training materials for you to use, modify, and share. We've got all of our open-source materials up on our beta teach.github.com site. Take a look, fork the repo, and send us a pull request!

Request an event

If you're interested in a private training session or in having a GitHubber speak at a conference you're organizing, please get in touch with us. We travel all over the world helping people know and love Git and GitHub better, so there's a good chance we can help you too. We are waiting to serve you.

The GitHub hiring experience

Crafting experiences is central to what we do here at GitHub, and our interviewing, hiring, and on-boarding experiences are no exception. Having recently been through this process first-hand, I’d like to share a little bit about what it’s like while it’s still fresh in my mind.

Welcome to GitHub

First contact

My story all started with a single email. I found myself kicking back with a beer one night reading some articles online, and I came across one of @kneath’s posts about how things are done at GitHub. I had read plenty of posts by various GitHubbers in the past, and I had always been very impressed by what I’d seen of their approach to business, technology, and other aspects of life. I had no idea if they were hiring or not, but a day or two after deciding to send Kyle an email to introduce myself, I was amazed to be chatting to him directly on Skype.

Every candidate’s first contact with GitHub is slightly different, but it’s almost always with a person who works in a role close to what the candidate’s would be—be it developer, designer, supportocat, ops, or something else. This conversation is a chance for us to get an initial sense of what the person is like to interact with, and to begin discussing the possibility of having them join our team.

My first chat with Kyle was very relaxed. We talked about my experiences, my thoughts about GitHub as a company, my typical design process, and how I approach my work in general. It was also very much a two-way conversation—Kyle answered all my questions and shared interesting insights into the company as we were talking. It didn’t feel like a typical interview, and it was far from being an adversarial, pressure-filled encounter. I didn’t know it at the time, but this vibe was set to continue throughout my hiring and on-boarding experience.

The reason we approach people’s first contact this way is simple. We believe it’s critical to ensure candidates have an initial discussion with someone who thoroughly understands the work they do. It gives us a sense of whether the person is likely to be a good fit for GitHub in terms of both skills and culture, but more importantly it sets the tone for the rest of the hiring experience. We hope skipping the initial paperwork-based screening process makes it clear to the candidate that we’re not playing games—that we’re genuinely interested in them.

For people we believe have a high probability of being a good fit for the company, the next step is to bring them into the office for face-to-face interviews.

Interviewing

Hiring good people is one of the most critical activities we do as a company, so we go to a lot of trouble to make sure interviewees feel important. By this stage we’ve got a good sense that they’ll make a great addition to the team, so it’s well worth investing in their experience to maximize candidates’ desires to work with us.

Ensuring people feel valued

For all interviewees, we fly them to San Francisco from wherever they live—even if it’s quite literally the other side of the world, like it was in my case. There is a driver with a sign waiting at the airport to take them to a comfortable hotel—which was an absolute godsend for me. I was stumbling out of the airport like a zombie after nearly 20 hours of flights from Australia, and seeing a sign with my name on it lifted my mood immediately. We do these things for interviewees to convey the message that GitHub values them from the outset—and that’s certainly how it came across for me.

Valuable people deserve a bespoke hiring experience, so we go to great lengths to work around interviewees’ existing commitments and schedules, or where people have families to take care of—a little flexibility goes a long way. I was juggling existing freelance work, holiday plans with my partner, as well as assignments and exam study for my last two subjects of my university degree—so to have GitHub’s Spirit Guide™ David be so flexible and helpful when arranging my trip was truly amazing.

People’s time is valuable too, so we make a point of moving quickly through the process. In my case, the time between contacting Kyle and having flights booked was only a couple of days. One other recent hire went from being a candidate to having a signed offer in just four days. By the time we’re flying someone out, we mean business.

The interview day

On my interview day, I was told to arrive at the office around 10 or so, where I was greeted by David (and a couple of dogs). David whisked me away to the kitchen for a beverage, and before long, the interviewing began.

I probably spoke with around 10 or 12 people over the course of the day, mostly two at a time, and everyone was amazingly friendly. My day also included pairing with @bleikamp on a design and some CSS, working through a production front-end issue with @jakeboxer, and also chatting one-on-one with @mojombo over a few beers going through some of my previous freelance work, talking him through my typical process, and generally getting to know each other. The whole experience was welcoming, open, and laid back; and I got the distinct impression that it was all about everyone simply getting to know me as a person, which turned out to be exactly what GitHub aims for.

My experience was a fairly typical one for candidates at GitHub. Generally speaking, you will have talked to a dozen or so people by the end of the day, paired on some real work, played some pool, seen around the office, and there’s also a good chance you’ll have been introduced to Slow Merge™, our very own GitHub-branded whiskey. We hope that by the time you leave we know you well enough to say that we want you to join the team, and that you think we’re awesome and want to work with us.

On-boarding

When anyone joins the GitHub team, we fly them back to San Francisco to spend their first week going through our on-boarding process. Each new hire is paired with a buddy that stays with them throughout the week, and I was lucky enough to have @jonrohan as mine. Buddies help new hires with things like setting up all their user accounts for the various services we use; introducing them to The Setup™ to get a development environment installed on their new laptop, and showing newbies how to go about shipping awesomeness to the world in whatever way they do best. I found it really reassuring to have a dedicated buddy to help me through my first week. Digesting the stupendous amount of information new Hubbers are exposed was made much smoother having someone to walk me through how it all works.

A typical induction week flies by in a blur of lunches, games of pool or insane more-than-two-player table tennis, beverages, :sparkles::tropical_fish::cherries:emoji:penguin::strawberry::star2:, getting to know Hubot, and shipping (of course)—so there’s plenty of time for people to settle in to the company and get to know their fellow Hubbernauts. By the end of the week the transformation from newbie to fully-fledged GitHubber is complete, and they’ll be ready to head out on their own to kick butt.

Good people make great experiences possible

All this experiential craftsmanship is the result of hard work by a number of people, and I’d like to take this opportunity to personally thank David, Melissa, Tom, Heather, Jenifer, Emma, and everyone else who plays a part in making this process such a pleasant one to go through for recent additions like myself and those to follow.

I believe that the best thing about the way we do hiring here at GitHub is that every new hire comes out knowing they are a valued and trusted part of the company. Ultimately, this means our business and products will be better as a result, and that the people who depend on our products every day to get work done will have better experiences.

GitHubbers hard at work

We want more good people

Speaking of hiring, we’re looking for a couple of people to join our team at the moment. Check out our listings on the GitHub job board, and if you think you’d be a good fit we’d love to hear from you.

How we ship GitHub for Windows

We’ve shipped 25 updates to GitHub for Windows in the 4 months since we first launched. That’s more than one release per week, for 17 weeks straight! Here’s how we do it.

One release per week — for a desktop app?!

At GitHub, we ship a lot. We think it’s so important to ship often, we even have a shipping mascot and matching emoji (:shipit:). Why do we do this?

Shipping rapidly is important to us for so many reasons. For example, the more frequently we ship the less likely it is for large numbers of changes to build up between releases, and shipping a small release is almost always less risky than shipping a big one. Shipping frequently also requires that we make it downright simple to ship by automating it, so anyone can do it. This raises our bus factor, and also democratizes the process of shipping so there aren’t “gatekeepers” who must sign off before any software goes out the door. And by shipping updates so often, there is less anxiety about getting a particular feature ready for a particular release. If your pull request isn’t ready to be merged in time for today’s release, relax. There will be another one soon, so make that code shine!

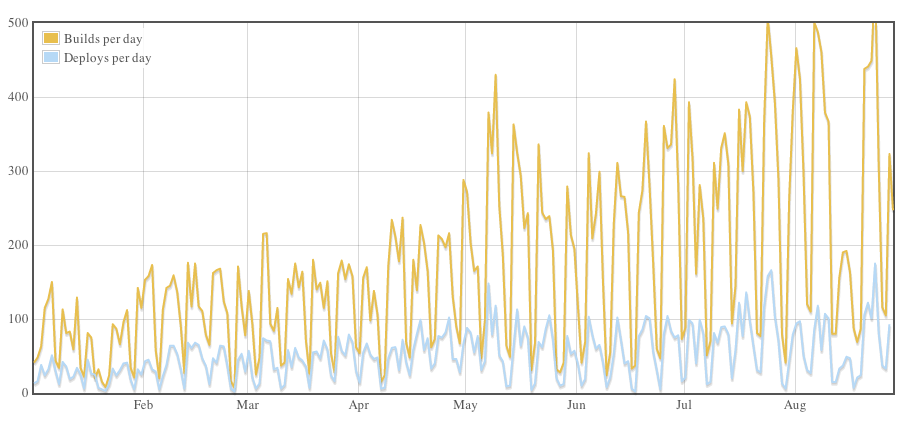
We really take this to heart. GitHub.com gets deployed hundreds of times each day. But we don’t think shipping often should be limited to web apps. We want all these same benefits for our native apps, too!

Let’s see how we’ve been doing with GitHub for Windows.

Some numbers

I said above that we’ve shipped 25 updates in 4 months. That comes out to about one release every 5 days, on average, and the median time between releases is only half that, 2.5 days. A full 75% of our updates so far shipped in less than 7 days.

The story is largely the same if you look at releases in terms of the number of commits that went into each release. We’ve made 1,176 commits on our master branch since our first release. That's 47 commits per release on average, with a median of 41 commits per release. 72% of GitHub for Windows updates so far have contained fewer than 50 commits.

Here’s a graph that shows all of our updates to GitHub for Windows thus far, with days since the previous release on the X axis and commits since the previous release on the Y axis:

GitHub for Windows updates, graphed by number of commits vs. number of days since previous release

That cluster of releases down in the bottom-left corner near the origin is exactly what we want. We work hard to make our updates as small as possible and to release them quickly, and I think the numbers bear that out.

So, how do we do it?

Automate everything (for us)

As I said earlier, shipping often requires that shipping be automated. When I joined GitHub back in March, shipping GitHub for Windows to our private beta group was a completely manual process, and Paul was the only one who knew how to do it. In fact, Paul was away my first week, so we weren’t able to ship an update we had all ready to go!

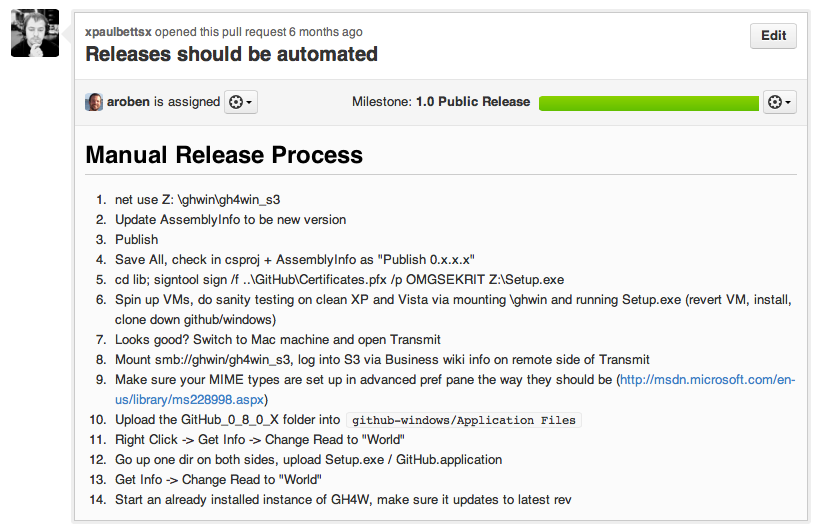
So Paul opened this issue in our GitHub for Windows repository:

"Releases should be automated" issue for GitHub for Windows

Even now, looking at that release process makes me cry.

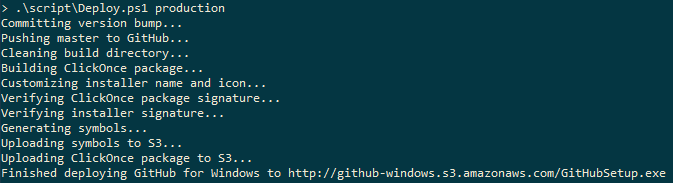
I, the bright-eyed, bushy-tailed newbie, got to work automating the process. Here’s how we deploy a release now:

Screenshot of running Deploy.ps1 script to deploy GitHub for Windows

One command, .\script\Deploy.ps1 production, is all it takes to build, package, and deploy a new GitHub for Windows release. We can also deploy just to GitHub staff, which we do for testing changes before releasing them to the public, by running .\script\Deploy.ps1 staff. Lowering the barrier to shipping means that anyone can ship an update, not just Paul, and that we can do it frequently, even multiple times a day.

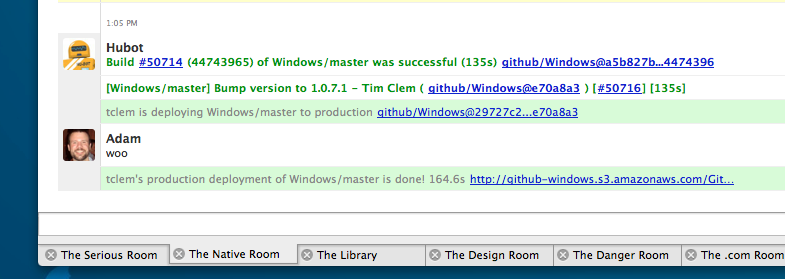
As Deploy.ps1 runs, it posts status to one of our Campfire chat rooms. This lets the rest of the team see what’s going on, saves a record of the deploy in Campfire’s logs for posterity, and lets us cheer each other on.

Screenshot of Campfire chat room showing progress from Deploy.ps1

In addition to deploying our installer, Deploy.ps1 uploads debug symbols (PDB files) for each release to our symbol server, a custom proxy backed by Amazon S3. This makes it possible to debug crash dumps from users. We even have some other PowerShell scripts to automate that so you don’t have to be a crash dump expert just to see what went wrong.

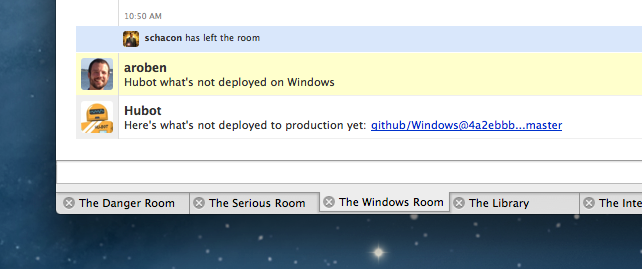
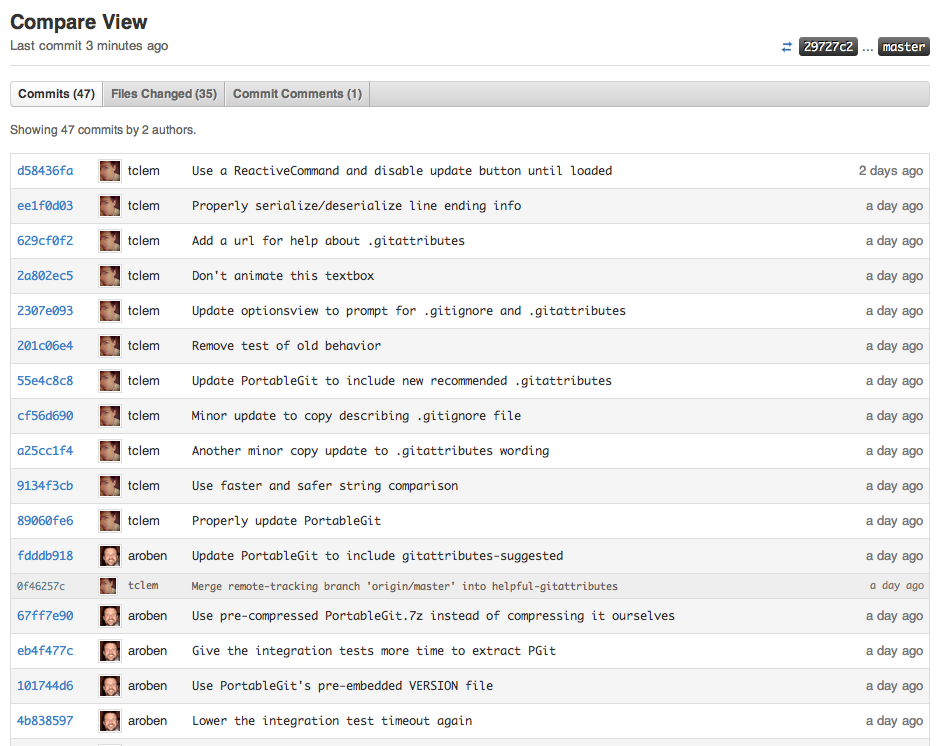
Every release contains a change log that details the most important fixes and improvements contained in that release. The change log is stored in a JSON file in the GitHub for Windows repository, and uploaded to S3 with each deploy. GitHub for Windows downloads the change log from S3 to show you what’s new in the update it’s about to install, and http://windows.github.com/ uses it to show release notes from all our past versions. When we decide it’s time to make a new release, we just ask Hubot what’s changed since our last release:

Screenshot of Campfire chat room with Hubot providing link to undeployed changes

Hubot provides a link to a compare view on GitHub.com that shows exactly what commits and pull requests haven’t yet been deployed, making writing a change log a breeze.

Screenshot of compare view on GitHub.com showing changes made between releases of GitHub for Windows

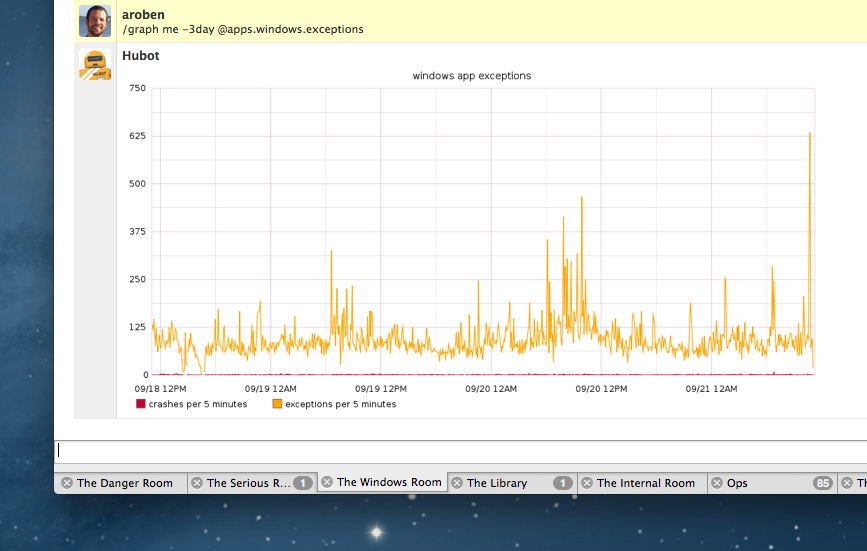
We also use Hubot to monitor releases after we ship them. For instance, whenever GitHub for Windows throws an exception or crashes, it sends information about the exception or crash to Haystack, our internal exception aggregation app. We can ask Hubot to show us data from Haystack to determine how many exceptions and crashes our users are seeing, which is particularly useful just after an update has been released:

Screenshot of Campfire chat room showing Hubot providing graph of GitHub for Windows crashes and exceptions

If we find that exceptions or crashes are increasing, we can go to Haystack to find out what’s going wrong.

We can even use Hubot to get an idea of how quickly users are updating to the latest version. Speaking of which…

Automate everything (for you)

Shipping so often would be for naught if our users weren’t actually installing our updates. So we’ve made downloading and installing updates to GitHub for Windows completely automated, too. GitHub for Windows checks for updates periodically, and when it finds one, it installs it in the background. The next time you relaunch the app, you’re automatically running the latest and greatest version, hot off our servers.

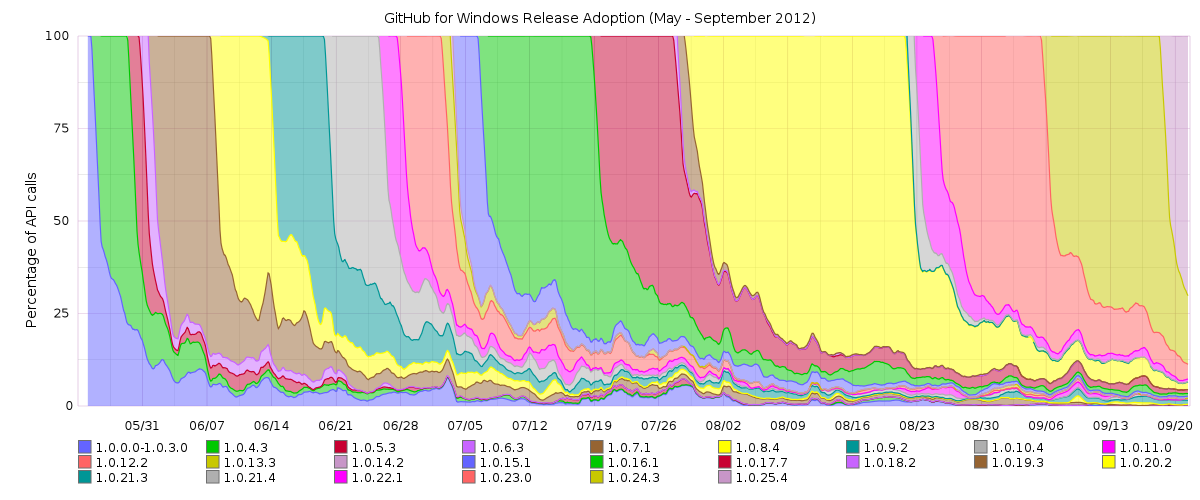
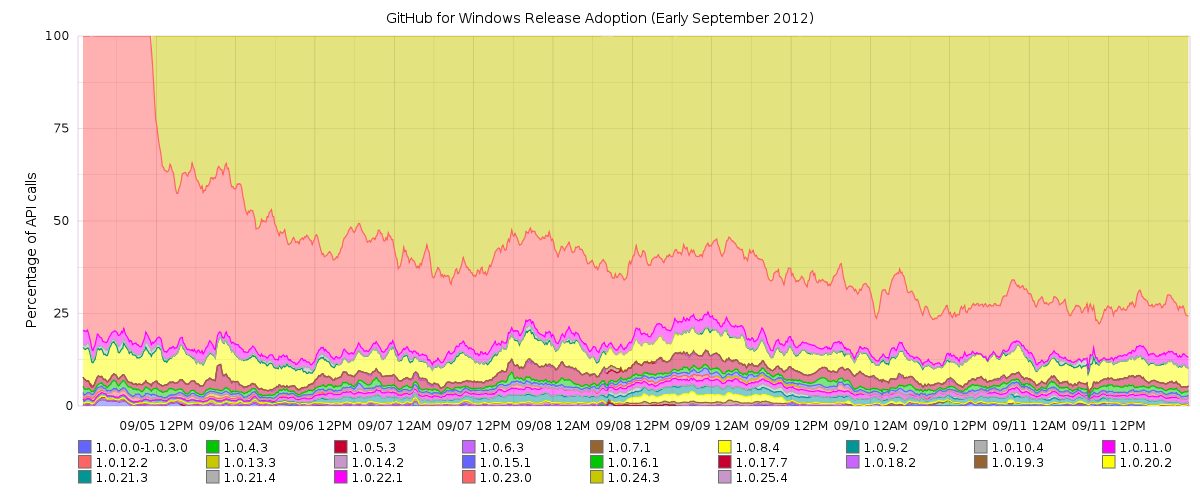
This results in our updates getting adopted by users remarkably quickly. Here’s a graph of all the GitHub for Windows releases we’ve made. On the X axis is time. On the Y axis is the percentage of total API calls to GitHub.com that are being made by each version of GitHub for Windows, stacked.

Graph of the percentage of API calls made by each version of GitHub for Windows, from May through September 2012

For example, on July 26th you can see that around 70% of API calls were coming from version 1.0.17.7, an additional 10% were coming from version 1.0.16.1, and older versions made up the remaining 20%.

The steep line when each release first appears gives you a good idea of how quickly releases start being used. But to really see just how quickly updates make it onto users’ machines, let’s zoom in on one week in early September, when we shipped our 1.0.24.3 update:

Graph of the percentage of API calls made by each version of GitHub for Windows, from Early September 2012

Within an hour, 25% of API calls were coming from the version we had just deployed. In 18 hours, it was over 50%. Within a week, it was over 70%.

This is really incredible. Even Google Chrome, which in many ways pioneered smooth, automatic updates for desktop software, only sees about 33% adoption in the first week after an update. By making the update process so smooth, we’re able to get bug fixes and new features into the hands of users just hours after deploying. Our users seem to like it, too; in 4 months we’ve gained over 125,000 users, and there’s no sign of it slowing down yet:

Graph showing GitHub for Windows installs from May through September 2012

We’re not done yet

It makes me incredibly happy to be able to ship GitHub for Windows so often and get it in users’ hands so quickly. But there’s still more to do. We’re always thinking about ways to make the download size of updates even smaller to help users on slow connections, and to make updates more reliable for users behind proxies. We want to make deploying even easier and more consistent with our other products by integrating with our Heaven Sinatra app. And we want to remove the few remaining manual steps to further reduce the chance of mistakes and to encourage shipping more often.

The more quickly and easily we can ship, the better GitHub for Windows will be, the happier we will be, and the happier our users will be.

GitHub availability this week

GitHub.com suffered two outages early this week that resulted in one hour and 46 minutes of downtime and another hour of significantly degraded performance. This is far below our standard of quality, and for that I am truly sorry. I want to explain what happened and give you some insight into what we're doing to prevent it from happening again.

First, some background

During a maintenance window in mid-August our operations team replaced our aging pair of DRBD-backed MySQL servers with a 3-node cluster. The servers collectively present two virtual IPs to our application: one that's read/write and one that's read-only. These virtual IPs are managed by Pacemaker and Heartbeat, a high availability cluster management stack that we use heavily in our infrastructure. Coordination of MySQL replication to move 'active' (a MySQL master that accepts reads and writes) and 'standby' (a read-only MySQL slave) roles around the cluster is handled by Percona Replication Manager, a resource agent for Pacemaker. The application primarily uses the 'active' role for both reads and writes.

This new setup provides, among other things, more efficient failovers than our old DRBD setup. In our previous architecture, failing over from one database to another required a cold start of MySQL. In the new infrastructure, MySQL is running on all nodes at all times; a failover simply moves the appropriate virtual IP between nodes after flushing transactions and appropriately changing the read_only MySQL variable.

Monday, September 10th

The events that led up to Monday's downtime began with a rather innocuous database migration. We use a two-pass migration system to allow for zero-downtime MySQL schema migration. This has been a relatively recent addition, but we've used it a handful of times without any issue.

Monday's migration caused higher load on the database than our operations team has previously seen during these sorts of migrations. So high, in fact, that they caused Percona Replication Manager's health checks to fail on the master. In response to the failed master health check, Percona Replication manager moved the 'active' role and the master database to another server in the cluster and stopped MySQL on the node it perceived as failed.

At the time of this failover, the new database selected for the 'active' role had a cold InnoDB buffer pool and performed rather poorly. The system load generated by the site's query load on a cold cache soon caused Percona Replication Manager's health checks to fail again, and the 'active' role failed back to the server it was on originally.

At this point, I decided to disable all health checks by enabling Pacemaker's maintenance-mode; an operating mode in which no health checks or automatic failover actions are performed. Performance on the site slowly recovered as the buffer pool slowly reached normal levels.

Tuesday, September 11th

The following morning, our operations team was notified by a developer of incorrect query results returning from the node providing the 'standby' role. I investigated the situation and determined that when the cluster was placed into maintenance-mode the day before, actions that should have caused the node elected to serve the 'standby' role to change its replication master and start replicating were prevented from occurring. I determined that the best course of action was to disable maintenance-mode to allow Pacemaker and the Persona Replication Manager to rectify the situation.

Upon attempting to disable maintenance-mode, a Pacemaker segfault occurred that resulted in a cluster state partition. After this update, two nodes (I'll call them 'a' and 'b') rejected most messages from the third node ('c'), while the third node rejected most messages from the other two. Despite having configured the cluster to require a majority of machines to agree on the state of the cluster before taking action, two simultaneous master election decisions were attempted without proper coordination. In the first cluster, master election was interrupted by messages from the second cluster and MySQL was stopped.

In the second, single-node cluster, node 'c' was elected at 8:19 AM, and any subsequent messages from the other two-node cluster were discarded. As luck would have it, the 'c' node was the node that our operations team previously determined to be out of date. We detected this fact and powered off this out-of-date node at 8:26 AM to end the partition and prevent further data drift, taking down all production database access and thus all access to github.com.

As a result of this data drift, inconsistencies between MySQL and other data stores in our infrastructure were possible. We use Redis to query dashboard event stream entries and repository routes from automatically generated MySQL ids. In situations where the id MySQL generated for a record is used to query data in Redis, the cross-data-store foreign key relationships became out of sync for records created during this window.

Consequentially, some events created during this window appeared on the wrong users' dashboards. Also, some repositories created during this window were incorrectly routed. We've removed all of the leaked events, and performed an audit of all repositories incorrectly routed during this window. 16 of these repositories were private, and for seven minutes from 8:19 AM to 8:26 AM PDT on Tuesday, Sept 11th, were accessible to people outside of the repository's list of collaborators or team members. We've contacted all of the owners of these repositories directly. If you haven't received a message from us, your repository was not affected.

After confirming that the out-of-date database node was properly terminated, our operations team began to recover the state of the cluster on the 'a' and 'b' nodes. The original attempt to disable maintenance-mode was not reflected in the cluster state at this time, and subsequent attempts to make changes to the cluster state were unsuccessful. After tactical evaluation, we team determined that a Pacemaker restart was necessary to obtain a clean state.

At this point, all Pacemaker and Heartbeat processes were stopped on both nodes, then started on the 'a' node. MySQL was successfully started on the 'a' node and assumed the 'active' role. Performance on the site slowly recovered as the buffer pool slowly reached normal levels.

In summary, three primary events contributed to the downtime of the past few days. First, several failovers of the 'active' database role happened when they shouldn't have. Second, a cluster partition occurred that resulted in incorrect actions being performed by our cluster management software. Finally, the failovers triggered by these first two events impacted performance and availability more than they should have.

In ops I trust

The automated failover of our main production database could be described as the root cause of both of these downtime events. In each situation in which that occurred, if any member of our operations team had been asked if the failover should have been performed, the answer would have been a resounding no. There are many situations in which automated failover is an excellent strategy for ensuring the availability of a service. After careful consideration, we've determined that ensuring the availability of our primary production database is not one of these situations. To this end, we've made changes to our Pacemaker configuration to ensure failover of the 'active' database role will only occur when initiated by a member of our operations team.

We're also investigating solutions to ensure that these failovers don't impact performance when they must be performed, either in an emergency situation or as a part of scheduled maintenance. There are various facilities for warming the InnoDB buffer pool of slave databases that we're investigating and testing for this purpose.

Finally, our operations team is performing a full audit of our Pacemaker and Heartbeat stack focusing on the code path that triggered the segfault on Tuesday. We're also performing a strenuous round of hardware testing on the server on which the segfault occurred out of an abundance of caution.

Status Downtime on Tuesday, September 11th

We host our status site on Heroku to ensure its availability during an outage. However, during our downtime on Tuesday our status site experienced some availability issues.

As traffic to the status site began to ramp up, we increased the number of dynos running from 8 to 64 and finally 90. This had a negative effect since we were running an old development database addon (shared database). The number of dynos maxed out the available connections to the database causing additional processes to crash.

We worked with Heroku Support to bring a production database online that would be able to handle the traffic the site was receiving. Once this database was online we saw an immediate improvement to the availability of the status site.

Since the outage we've added a database slave to improve our availability options for unforeseen future events.

Looking ahead

The recent changes made to our database stack were carefully made specifically with high availability in mind, and I can't apologize enough that they had the opposite result in this case. Our entire operations team is dedicated to providing a fast, stable GitHub experience, and we'll continue to refine our infrastructure, software, and methodologies to ensure this is the case.

How we keep GitHub fast

The most important factor in web application design is responsiveness. And the first step toward responsiveness is speed. But speed within a web application is complicated.

Our strategy for keeping GitHub fast begins with powerful internal tools that expose and explain performance metrics. With this data, we can more easily understand a complex production environment and remove bottlenecks to keep GitHub fast and responsive.

Performance dashboard

Response time as a simple average isn’t very useful in a complex application. But what number is useful? The performance dashboard attempts to give an answer to this question. Powered by data from Graphite, it displays an overview of response times throughout github.com.

We split response times by the kind of request we’re serving. For the ambiguous items:

  • Browser - A page loaded in a browser by a logged in user.
  • Public - A page loaded in a browser by a logged out user.

Clicking one of the rows allows you to dive in and see the mean, 98th percentile, and 99.9th percentile response times.

The performance dashboard shows performance information, but it doesn't explain. We needed something more fine-grained and detailed.

Mission control bar

GitHub staff can browse the site in staff mode. This mode is activated via a keyboard shortcut and provides access to staff-only features, including our Mission control bar. When it’s showing, we see staff-only features and have the ability to moderate the site. When it’s hidden, we’re just regular users.

Spoiler alert: you might notice a few things in this screenshot that haven’t fully shipped yet.

The left-hand side shows which branch is currently deployed and the total time it took to serve and render the page. For some browsers (like Chrome), we show a detailed breakdown of the various time periods that make up a rendered page. This is massively useful in understanding where slowness comes from: the network, the browser, or the application.

The right-hand side is a collection of various application metrics for the given page. We show the current compressed javascript & css size, background job queue, and various data source times. For the ambiguous items:

  • render – How long did it take to render this page on the server?
  • cache – memcached calls.
  • sql – MySQL calls.
  • gitGrit calls.
  • jobs – The current background job queue.

When we’re ready to make a page fast we can dive into some of these numbers by clicking on them. We’ve hijacked many features from rack-bug and query-reviewer to produce these breakdowns.

And many more…

It goes without saying that we use many other tools like New Relic, Graphite, and plain old UNIX-foo to aid in our performance investigations as well.

A lot of the numbers in this post are much slower than I’d like them to be, but we’re hoping with better transparency we’ll be able to deliver the fastest web application that’s ever existed.

As @tnm says: it’s not fully shipped until it’s fast.

Deploying at GitHub

Deploying is a big part of the lives of most GitHub employees. We don't have a release manager and there are no set weekly deploys. Developers and designers are responsible for shipping new stuff themselves as soon as it's ready. This means that deploying needs to be as smooth and safe a process as possible.

The best system we've found so far to provide this flexibility is to have people deploy branches. Changes never get merged to master until they have been verified to work in production from a branch. This means that master is always stable; a safe point that we can roll back to if there's a problem.

The basic workflow goes like this:

  • Push changes to a branch
  • Wait for the build to pass on our CI server
  • Tell Hubot to deploy it
  • Verify that the changes work and fix any problems that come up
  • Merge the branch into master

Not too long ago, however, this system wasn't very smart. A branch could accidentally be deployed before the build finished, or even if the build failed. Employees could mistakenly deploy over each other. As the company has grown, we've needed to add some checks and balances to help us prevent these kinds of mistakes.

Safety First

The first thing we do now, when someone tries to deploy, is make a call to Janky to determine whether the current CI build is green. If it hasn't finished yet or has failed, we'll tell the deployer to fix the situation and try again.

Next we check whether the application is currently "locked". The lock indicates that a particular branch is being deployed in production and that no other deploys of the application should proceed for the moment. Successful builds on the master branch would otherwise get deployed automatically, so we don't want those going out while a branch is being tested. We also don't want another developer to accidentally deploy something while the branch is out.

The last step is to make sure that the branch we're deploying contains the latest commit on master that has made it into production. Once a commit on master has been deployed to production, it should never be “removed” from production by deploying a branch that doesn’t have that commit in it yet.

We use the GitHub API to verify this requirement. An endpoint on the github.com application exposes the SHA1 that is currently running in production. We submit this to the GitHub compare API to obtain the "merge base", or the common ancestor, of master and the production SHA1. We can then compare this to the branch that we're attempting to deploy to check that the branch is caught up. By using the common ancestor of master and production, code that only exists on a branch can be removed from production, and changes that have landed on master but haven't been deployed yet won't require branches to merge them in before deploying.

If it turns out the branch is behind, master gets merged into it automatically. We do this using the new :sparkles:Merging API:sparkles: that we're making available today. This merge starts a new CI build like any other push-style event, which starts a deploy when it passes.

At this point the code actually gets deployed to our servers. We usually deploy to all servers for consistency, but a subset of servers can be specified if necessary. This subset can be by functional role — front-end, file server, worker, search, etc. — or we can specify an individual machine by name, e.g, 'fe7'.

Watch it in action

What now? It depends on the situation, but as a rule of thumb, small to moderate changes should be observed running correctly in production for at least 15 minutes before they can be considered reasonably stable. During this time we monitor exceptions, performance, tweets, and do any extra verification that might be required. If non-critical tweaks need to be made, changes can be pushed to the branch and will be deployed automatically. In the event that something bad happens, rolling back to master only takes 30 seconds.

All done!

If everything goes well, it's time to merge the changes. At GitHub, we use Pull Requests for almost all of our development, so merging typically happens through the pull request page. We detect when the branch gets merged into master and unlock the application. The next deployer can now step up and ship something awesome.

How do we do it?

Most of the magic is handled by an internal deployment service called Heaven. At its core, Heaven is a catalog of Capistrano recipes wrapped up in a Sinatra application with a JSON API. Many of our applications are deployed using generic recipes, but more complicated apps can define their own to specify additional deployment steps. Wiring it up to Janky, along with clever use of post-receive hooks and the GitHub API, lets us hack on the niceties over time. Hubot is the central interface to both Janky and Heaven, giving everyone in Campfire great visibility into what’s happening all of the time. As of this writing, 75 individual applications are deployed by Heaven.

Always be shipping

Not all projects at GitHub use this workflow, which is core to github.com development, but here are a couple of stats for build and deploy activity company-wide so far in 2012:

  • 41,679 builds
  • 12,602 deploys
  • The lull in mid-August was our company summit, which kicked off the following week with a big dose of inspiration. Our busiest day yet, Aug. 23, saw 563 builds and 175 deploys.

Something went wrong with that request. Please try again.